Most research in Finance considers quantitative data. But there are fascinating data bases that contain financially relevant text. For example, consider the SEC EDGAR data base with its letters to shareholders, 10-K forms, etc. But how do you determine a text’s tone? It is easy to compare a stock return of 5% to a stock return of 10% – the second is twice the first. In contrast, how would you judge “excellent” compared to “brilliant”? What is the word tone of these terms?
First pass to determine word tone: Dictionaries
Empirical studies often use the Loughran/McDonald dictionary to determine whether a given word is positive or negative. However, such dictionary classifications can be problematic since “leverage” in Finance means something different compared to its regular usage.
A new approach: Let the data speak for itself!
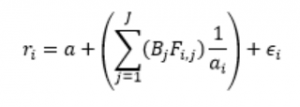
In their 2013 Journal of Financial Economics paper “Word power: A new approach for content analysis”, Jegadeesh and Wu develop an alternative approach. Their main idea is to consider the impact of specific terms on financial markets. As sources for the words, they use all 10-K filings with the SEC between 1995 and 2010. To identify important words, they then run a linear regression. The dependent variable in the regression is the excess return r_i for the stock of firm i during the three days after the firm’s 10-K filing. The explanatory variable F_i,j measures how often word j occurs in the filing. The authors standardize F_i,j by the total number of words a_i in the filing:
The advantage of this approach: You do not have to assign a “tone” to the word in advance. Instead, you use the market reactions to determine whether “excellent” is better than “brilliant”.
Initial public offerings
Once the authors have determined the words’ tone, they apply these results in a different context: Initial Public Offerings (IPOs). IPO show a particular pattern: Newly issued stocks usually show strong price increases during the first trading day. Hence, the IPO price is too low, compared to the price the market is willing to pay for the stock. This phenomenon leads to the term “IPO underpricing” – the difference price of the stock at the end of the first trading day and the IPO price.
Prospectus word tone and IPO underpricing
The main idea of Jegadeesh and Wu is that a “better” tone of the firm’s IPO prospectus should lead to a higher IPO price, and thus decrease the IPO underpricing. So, they first calculate the aggregate tone of the IPO prospectus. Then, they run a linear regression with the IPO underpricing as the dependent variable and the prospectus tone as the explanatory variable. In addition, they include firm-specific control variables volatility, IPO size, etc. Table 1 provides the results.
| Model 1 | Model 2 | Model 3 | |
| Tone negative | -2.834 | ||
| Tone positive | -4.898 | ||
| Tone combined | -3.305 |
Table 1: Prospectus tone and IPO underpricing. Information taken from Table 10 of Jegadeesh and Wu (2013). Bold font indicates statistical significance at the 5% level or higher.
All coefficient estimates are negative and statistically significant. Hence, a better prospectus tone decreases the IPO underpricing.
In a nutshell: Text data speaks for itself!
In summary: Prior research in textual analysis exogenously assigned tone to words. Alternatively, you can let the data speak for itself, and compute a word’s tone by its market impact. The scores you determine in this way are universally applicable – whether for 10-K filings and stock returns, or IPO prospectuses and IPO underpricing.
You may also like