We already explored the VIX as a measure of uncertainty in our post from March 13, 2017. Academic research has also explored the VIX as a trading indicator.
Predicting S&P 500 futures returns
In their 2001 Journal of Futures Markets article “S&P Futures Returns and Contrary Sentiment Indicators”, researchers Simon and Wiggins first analyze whether the VIX (and two further indicators, the put-call ratio and the trading index TRIN) can predict S&P 500 futures returns using a regression analysis. Next, the authors check whether such a relation gives rise to a valuable trading strategy. To do so, they predict S&P futures returns out-of-sample (based on the previous year’s parameters, and the current VIX level). The intuition: when the VIX has a high value, investors are currently over-cautious. This results in underpricing, and future returns will be high as soon as investors revert back to their normal state.
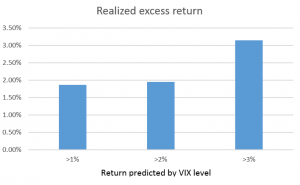
Figure 1. Monthly realized excess return, conditional an buy signal derived from VIX level (Source: Simon and Wiggins, 2001)
The evidence
The empirical analysis verifies that high returns follow VIX increases. The impact is substantial: when the VIX takes on a value in its top 10%, S&P futures are higher by 2.7% within a month (and the effect is also statistically significant). A trading strategy exploiting this relation (invest in the S&P futures if the VIX level predicts a 1%, 2%, or 3% return) generates returns of 3% to 4% per month – after transaction costs have been taken into account. Similarly, risk-adjusted performance (measured via the Sharpe ratio) ranges from 0.4 to 0.8.
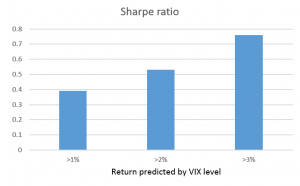
Figure 2. Sharpe ratio, conditional on buy signal derived from VIX (Source: Simon and Wiggins, 2001)
In summary: Investors can realize higher returns by making an opposite call to the general market sentiment.
You may also like