On June 14, 2017, a fridge-freezer on the 4th floor of the Grenfell Tower block in London caught fire. The fire quickly spread, causing a horrible loss of at least 80 lives and injuring more than 70 people. Firefighters quickly found out that the tower’s façade panels had facilitated the fire spreading.
Metal engineering and manufacturing company Arconic had provided the panels used for the Grenfell Tower block. On June 26, Arconic announced that they would not use the material again in any tall building around the world.
The economic context
As economists, we hope that firms take all feasible measures to prohibit such horrible events – because it is in their own economic interest. Loss of reputation through the association with a major disaster, victims’ claims against the firm, and other customers’ demands for replacements of faulty materials – all these are a major cost for firms. Firms’ future profitability and risk should reflect this cost. Eventually, firms who do not avoid these risks must pay a higher cost-of-capital. So, we hope that firms behave “ethically” because markets “punish” unethical behavior as economically unsound.
Are firms punished for their misbehavior?
But does this mechanism work? Are firms punished for their misbehavior? And do markets react to firms’ claims that they will take all necessary steps to prohibit future tragedies? Our econometric toolbox offers a number of approaches to analyze the impact of an event on the profitability of a firm. The simplest: compare average profitability and risk measures (such as stock returns, or CDS spreads) prior to and after the event, using a t-test of different means.
T-test and type-1 error
One downside of this simple method: you implicitly assume that only the event affects your observations. E.g., assume that stock prices in the entire market decreased during June. Now you compare the stock returns of, say, Vodafone, before and after June 14. You will find that Vodafone’s returns are higher before June 14 and lower afterwards – possibly significantly so. But you know that the Grenfell Tower disaster had no impact on Vodafone – you’ve just committed a type 1 error!
Back to Arconic. If you compare their stock returns before and after the fire and find a significant difference – how do you know there is no simple alternative explanation? Maybe you omitted an important explanatory variables that can explain the effect – such as a time trend?
The intuition behind a regression discontinuity design
You can avoid such endogeneity issues via a regression discontinuity (RD) analysis. In essence, RD detects a jump in the dependent variable (here: CDS spreads and stock returns) around a specified cutoff in the explanatory variable (here: time to/from the event). To detect the jump, you estimate two different regression lines on either side of the cutoff. You then look at the variable of interest as you move towards the cutoff from the right and from the left. You attribute the difference between the two limits to the “event” causing the cutoff. For simplicity, we just look at time here – but you can plug in any number of additional explanatory variables.
The economic impact of the Grenfell Tower disaster using RD
Let’s start with June 14. Figure 1 shows the changes of the CDS spread and the stock returns (on the y-axis) as a function of time (on the x-axis). The vertical line indicates June 14.
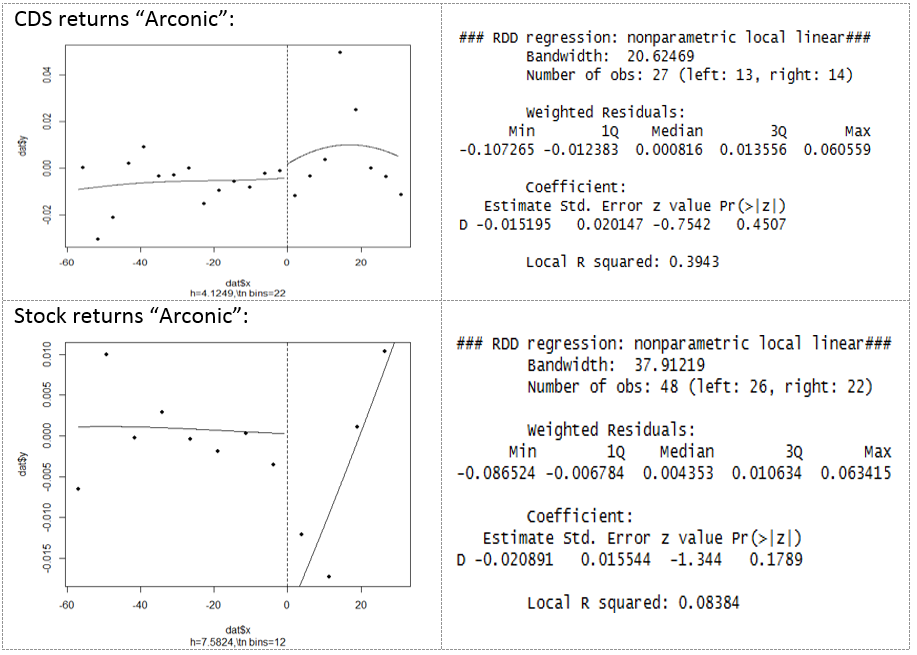
Figure 1: Regression discontinuity for Arconic’s CDS spreads and stock returns around June 14
The upper left panel of Figure 1 shows that CDS hardly react after June 14. As discussed above, the RD first determines the relation between the CDS spread and time to the left of the cutoff. This relation is “non-existent” and therefore corresponds to a straight line. Next, the RD determines the relation between the CDS spread and time to the right of the cutoff – a curved line. These two lines almost touch at the cutoff point – an indication that the event has no impact on CDS spreads. The formal test (upper right panel) agrees with this visual intuition: with a p-value of 0.4507, we cannot reject the null hypothesis that CDS are the same before and after the cutoff.
For stock returns (lower left panel), we observe a large discontinuity between the flat line to the left of the cutoff and the upwards-sloping line to the right. But as for CDS, this visually impressive jump is not statistically significant: we cannot reject the null of no jump due to the p-value of 0.1789. In summary, markets didn’t punish Arconic immediately after the fire.
Did taking responsibility help Arconic?
What about the announcement date of the change in cladding material (June 26)? We run the same analysis around this new cutoff. The results are depicted in Figure 2.
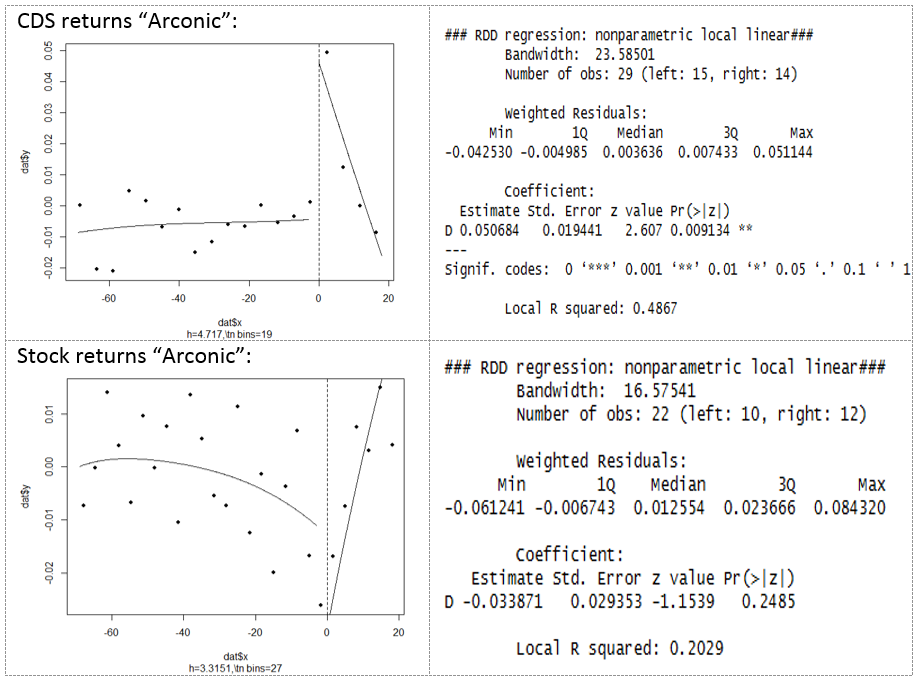
Figure 2: Regression discontinuity for Arconic’s CDS spreads and stock returns around June 26
In Figure 2, we observe a sizeable (around 5%) and significant (at the 1% level) discontinuity for CDS (upper left and right panel). The higher value indicates that investors perceive Arconic as more risky after the announcement. Stock returns, on the other hand, again do not exhibit a significant with a p-value of 0.2485.
In summary, we find no evidence for stock markets believing that the Grenfell Tower disaster will affect the profitability of Arconic. In a future analysis, we’ll repeat the analysis around one more event: the investor lawsuit filed against Arconic in Manhattan on July 13, 2017.
You may also like